
Open Access, Volume 10
Genetically modified Wnt signaling data analysed using machine learning
Nikolaos Doumpas2†; Petros Paplomatas1†; Aris Vrahatis1*
1Department of Informatics, Bioinformatics and Human Electrophysiology Laboratory, Ionian University, 49100 Corfu, Greece.
2School of Science and Technology, Hellenic Open University, Greece.
†Equal Contribution.
Aris Vrahatis
Department of Informatics, Bioinformatics and Human Electrophysiology Laboratory, Ionian University,
49100 Corfu, Greece.
Email: aris.vrahatis@ionio.gr
Received : Mar 06, 2024,
Accepted : Apr 05, 2024
Published : Apr 10, 2024,
Archived : www.jclinmedcasereports.com
Abstract
Signaling pathways are vital for the development of organisms, orchestrating a plethora of biological processes. Pathways failing to function properly can cause numerous disorders, including neurodegenerative diseases and malignant tumors. Only a handful of highly conserved signaling pathways are able to specify cell fates during development. Wnt signaling is one of those and it is known to be involved in development, tissue maintenance and homeostasis. Wnt signalling’s importance is underlined by its conserved presence in almost all mammalian organisms. Mis-regulation of Wnt signaling can result in numerous diseases. We used previously published Rna-seq datasets, deriving from gene edited Hek293T cell lines. Those cells lines lack major components of the Wnt signalling pathway. Here, we are combining machine learning together with traditional statistical analysis methods, in order to analyze the RNA-seq data, but also to compare the robustness of machine learning versus traditional statistical analysis methods. In addition, enrichment analysis based both on machine learning and statistical analysis, is been introduced. Finally, we reveal numerous genes, which are potentially linked to diseases for the first time, utilizing our A.I. analysis.
Keywords: Wnt signalling; Machine learning; Statistical analysis; Rna-sequencing.
Copy right Statement: Content published in the journal follows Creative Commons Attribution License (http://creativecommons.org/licenses/by/4.0). © Vrahatis A (2024)
Journal: Open Journal of Clinical and Medical Case Reports is an international, open access, peer reviewed Journal mainly focused exclusively on the medical and clinical case reports.
Citation: Doumpas N, Paplomatas P, Vrahatis A. Genetically modified Wnt signaling data analysed using machine learning. Open J Clin Med Case Rep. 2024; 2223.
Introduction
Wnt signaling pathway is highly conserved from the most primitive animals to humans, which con- Wnt signaling pathway is highly conserved from the most primitive animals to humans, which controls a plethora of cell fate decisions during development, playing a vital role in the early stages of development [1], tissue maintenance [2], while it is also active in stem cell compartments of adult tissues. Wnt signaling was first discovered due to its link with cancer [3]. Examples of cancer types where Wnt signaling is involved are: gastrointestinal [4], leukemia [5] and breast cancer [6]. Today, there are 19 Wnt genes identified in mammals and 7 in Drosophila.
In the pathways active state Wnt ligands, which are present in the extracellular space are able to bound to the Frizzled [7] receptor and LRP [8] co-receptors. This binding stimulates the accumulation of cytosolic β-catenin, followed by its nuclear localization. Stabilized β-catenin can enter the nucleus, where it associates with T Cell Factor/Lymphoid Enhancer Factor (TCF/LEF) family in order to activate the transcription of Wnt target genes [9]. Of note, β-catenin cannot bind directly to the DNA, thus TCF/Lef factors are the link that allows β-catenin to bind to the DNA.
Cell lines lacking all TCF/LEF proteins and/or β-catenin, were stimulated with two approaches, using WNT3a recombinant protein and GSK-3 inhibitor (Chir). Unstimulated cell lines were used as control. CHIR-stimulated, WNT3a-stimulated and control cell lines were subjected to RNA-sequencing. The raw RNA-seq data that are used and analyzed in this dissertation were initially published in Embo Journal in 2019 [10].
The extended use of whole-genome sequencing techniques such as DNA-seq, RNA-seq, ChIP-seq, single-cell RNA, proteomics and metabolomics generates an immense amount of data, thus encouraging a growing use of machine learning in biology. Machine learning is a valuable tool for analyzing large data with many individual points, for data which contain a large number of features or when it is desired to automate the data analysis pipeline [11]. When large amounts of data are available, highly parameterized models, such as deep learning can provide an elegant solution [12]. The biggest challenge of modelling biological data is the sheer variety and diversity of the data [13]. Biological data can vary from gene sequences, gene expression levels, to 3D structures and microscopy images. Due to this diversity, there are no off-the-shelf, ready to use tools for the use of machine learning in those biological data [14]. The choice of model, training and test depends heavily on the question one needs to answer. So far traditional machine learning methods are seen as the first area to explore in finding the most appropriate method for a given biological problem.
Our aim here is to combine whole genome sequencing data, RNA-seq, with machine learning techniques. Furthermore, combining machine learning with traditional statistical analysis will strengthen the findings of the analysis. Utilizing both traditional statistical methods and machine learning in RNA-seq analysis offers a synergistic approach that harnesses the strengths of both techniques. While traditional statistical methods excel at identifying differentially expressed genes based on set thresholds and assumptions, machine learning can capture intricate patterns and interactions that might be overlooked by conventional methods alone. By integrating machine learning, one can delve deeper into the data, uncovering non-linear relationships and providing robust predictive models. This combined approach ensures a more comprehensive and nuanced analysis, maximizing the chances of pinpointing reliable and biologically relevant data.
To further refine the analysis, we employed the Borda Count in order to amalgamate the insights derived from both statistical and machine learning techniques in RNA-seq analysis. This judicious integration enhances the robustness of the results, drawing from the unique strengths of each approach. This holistic strategy not only counteracts the individual limitations of each method but also instills greater confidence in the final set of biomarkers, paving the way for a more rigorous and comprehensive analysis. Finally, gene group overlap through the different treatments will provide a more robust understanding of Wnt signaling.
Methods
In our study, we deployed an integrated computational framework that combines statistical and machine learning analyses with a gene sorting methodology to dissect and interpret genomic datasets. For this we used an interesting RNA-seq data set published in 2019 by (Doumpas et al. 2019). This novel approach allowed for a comprehensive exploration of the genomic intricacies present within our research. To achieve this, the dataset was systematically divided into 20 distinct categories, each representing a unique combination of conditions and variables. The 20 groups generated here dipict the different cell types and treatmetns that were used, such as “WT-unstim” which is the control group, “WT-chir” which are wild type cells treated with Chir, “WT-Wnt3a” containing cells which were treated with recombinant Wnt3a protein (Table 1). D4Tcf describes cells lacking all four TCF/LEF factors. dBcat characterizes cells which lack only beta-catenin This categorization was crucial for tailoring our analyses to be specific and relevant to each set of experimental conditions, thus enabling a more detailed and precise understanding of the dataset’s underlying patterns and trends.
Table 1: Comparison of genetic and treatment conditions in mouse models.
| Group | Comparison description | Condition A | Condition B |
|---|---|---|---|
| 1 | WT unstimulated vs WT Chir | WT unstimulated | WT Chir |
| 2 | WT unstimulated vs WT Wnt3a | WT unstimulated | WT Wnt3a |
| 3 | dBcat unstimulated vs dBcat Wnt3a | dBcat unstimulated | dBcat Wnt3a |
| 4 | dBcat unstimulated vs dBcat Chir | dBcat unstimulated | dBcat Chir |
| 5 | d4Tcf unstimulated vs d4Tcf Wnt3a | d4Tcf unstimulated | d4Tcf Wnt3a |
| 6 | d4Tcf unstimulated vs d4Tcf Chir | d4Tcf unstimulated | d4Tcf Chir |
| 7 | d4Tcf_dBcat unstimulated vs d4Tcf_dBcat Wnt3a | d4Tcf_dBcat unstimulated | d4Tcf_dBcat Wnt3a |
| 8 | d4Tcf_dBcat unstimulated vs d4Tcf_dBcat Chir | d4Tcf_dBcat unstimulated | d4Tcf_dBcat Chir |
| 9 | WT Chir vs dBcat Chir | WT Chir | dBcat Chir |
| 10 | WT Chir vs d4Tcf | WT Chir | d4Tcf |
| 11 | WT Chir vs d4Tcf_dBcat Chir | WT Chir | d4Tcf_dBcat Chir |
| 12 | WT Wnt3a vs dBcat Wnt3a | WT Wnt3a | dBcat Wnt3a |
| 13 | WT Wnt3a vs d4Tcf Wnt3a | WT Wnt3a | d4Tcf Wnt3a |
| 14 | WT Wnt3a vs d4Tcf_dBcat Wnt3a | WT Wnt3a | d4Tcf_dBcat Wnt3a |
| 15 | WT unstimulated vs WT Chir vs WT Wnt3a | WT unstimulated | WT Chir, WT Wnt3a |
| 16 | dBcat unstimulated vs dBcat Chir vs dBcat Wnt3a | dBcat unstimulated | dBcat Chir, dBcat Wnt3a |
| 17 | d4Tcf unstimulated vs d4Tcf Chir vs d4Tcf Wnt3a | d4Tcf unstimulated | d4Tcf Chir, d4Tcf Wnt3a |
| 18 |
d4Tcf_dBcat unstimulated vs
d4Tcf_dBcat Chir vs
d4Tcf_ dBcat Wnt3a |
d4Tcf_dBcat unstimulated | d4Tcf_dBcat Chir, d4Tcf_dBcat Wnt3a |
| 19 | WT unstimulated vs all Chir treated conditions | WT unstimulated | All Chir treated |
| 20 | WT unstimulated vs all Wnt3a treated conditions | WT unstimulated | All Wnt3a treated |
Integrated analysis approach
Statistical analysis: We performed differential expression analysis on each group utilizing the DESeq2 [15] package, acclaimed for its effectiveness in analyzing differential gene expression from raw count data. The Likelihood Ratio Test (LRT) was chosen to discern genes exhibiting significant expression differences across conditions. Following this, we selected the top 500 genes from each group based on the criteria of minimal False Discovery Rate (FDR) and maximal absolute log2 Fold Change (logFC). This process aimed to prioritize genes demonstrating not only significant differential expression but also significant changes in expression magnitude.
Machine learning analysis: Concurrently, we employed the Random Forest (RF) algorithm using the package caret [16] to identify the most impactful variables within our dataset. Prior to model training, we conducted pre-processing steps such as centering, scaling, and imputation of missing values via the k-nearest neighbors method. To ensure the model’s integrity and to mitigate overfitting, we implemented a 10-fold cross-validation strategy. After training, variable importance scores were determined, and the top 500 variables were selected for further examination. This method enabled the identification of genes or features with significant influence on our dataset.
Gene sorting and integration: A key phase in our analysis was the identification of genes consistently present across the dataset, focusing on those found in at least 50% of the datasets. This selective approach ensured our attention was directed towards genes with significant and consistent presence, thereby avoiding anomalies or infrequent occurrences.
Ensemble strategy for comprehensive gene ranking and integration
Borda vote integration: We employed an ensemble method, specifically the Borda Count technique [17], to combine and rank genes according to their occurrence across different gene lists obtained from our statistical and machine learning analyses. This advanced approach facilitated the creation of a unified list comprising the top 100 genes, integrating insights from both analytical methods. The resulting integrated ranking highlighted the most significant genes, those repeatedly emphasized across our comprehensive analytical framework. This method ensured an equitable and exhaustive evaluation of gene importance within the varied analytical results, offering a complete perspective on the principal genetic determinants in our dataset.
Enrichment analysis: Subsequent to the gene sorting process using statistical methods, machine learning techniques, and the ensemble strategy, we embarked on an enrichment analysis. The GO_Biological_ Process_2021 and GO_Molecular_Function_2021 databases were instrumental in elucidating the roles and significance of the selected genes. This critical step afforded a biological context to our findings, bridging our analytical endeavors with tangible biological processes and functions. Through this analysis, we were able to link the computational insights to real-world biological mechanisms, thereby enhancing the relevance and impact of our study’s outcomes.
Results
Our comprehensive exploration of Wnt signaling utilized an integrated approach combining statistical analysis and machine learning to investigate RNA-seq data deriving from four genetically distinct HEK 293T cell lines: Wild Type (WT) as control, dBcat (β-catenin knockout), d4Tcf (TCF/LEF knockout but retains β-catenin), and d4Tcf_dBcat (lacking both β-catenin and TCF/LEF). These cell lines were subjected to three treatments-unstimulated (control), Wnt3a, and Chir-to dissect the nuances of Wnt pathway activation across different genetic contexts. Conducted in triplicate, this setup spanned 12 experimental conditions aimed at unraveling the pathway’s behavior under varied genetic modifications and treatments. More details about the experimental conditions can be found in Doumpas et al. 2019) The data were segmented into 20 groups based on the 500 most upregulated genes, facilitating a rich comparison landscape to derive biologically meaningful insights. The 500 upregulated gene limit is an arbitrary one and was selected in order to be able to have an identical number of genes for both types of analysis. Furthermore, we believe that 500 genes can generate a reasonable biological picture while simultaneously being easy to work with.
Utilizing the 20 groups that we generated we wanted to find out the number of genes which stayed expressed in all or most of the groups. The use of heatmaps for visual exploration of gene expression overlaps among these groups, leveraging traditional statistical analysis grounded in criteria of minimal False Discovery Rate (FDR) and maximal absolute log2 Fold Change (logFC), revealed pronounced overlaps. Notably, the comparison between Group 1 (WT unstimulated vs WT Chir) and Group 2 (WT unstimulated vs WT Wnt3a) demonstrated a significant commonality of 133 genes, showcasing the method’s efficacy in identifying gene expression patterns across treatments. This visual representation underscored the data’s reliability and the Wnt pathway’s consistent activation across different activation methods, albeit with variances attributable to the differing activation potencies of Chir and Wnt3a, indicating nuanced responses of the cell lines to varying activation strengths (Figure 1).
Since the analysis is reliable and the groups show the expected behavior, we can focus now on further interesting at unexpected group overlaps. One important finding is the comparison of group 3 and group 5. In group 3 the response on Wnt3a treatment of a cell line that lacks β-catenin is investigated. In group 5, the response on Wnt3a treatment of a cell line that lacks all TCFs is investigated. The comparison between group 3 versus group 5, reveals an overlap of only 38 out of 500 genes. Of note, that the stimulation that was used in both groups is Wnt3a recombinant protein. This finding can be interpreted as follows, it is of high importance for the cell whether β-catenin or TCFs are lacking, since the Wnt response is very different. If the response was the same, one would expect a higher overlap. Furthermore, there is no global response mechanism in the absence of Wnt components but rather a defined set of genes is activated depending on the Wnt signaling component that is missing. Furthermore, the heatmap generated here clearly shows that indeed there is gene overlap between the different groups, with lots of variation on the overlap percentage. Of note, despite the different genetic petrubations and treatments, there are always overlapping genes. This type of analysis, the amount of data and comparisons presented in the heatmap is providing a great source for wet lab experimetns and further understanding of the Wnt signalling pathway. There are numerous experimental questions that can be adressed using that heatmap.
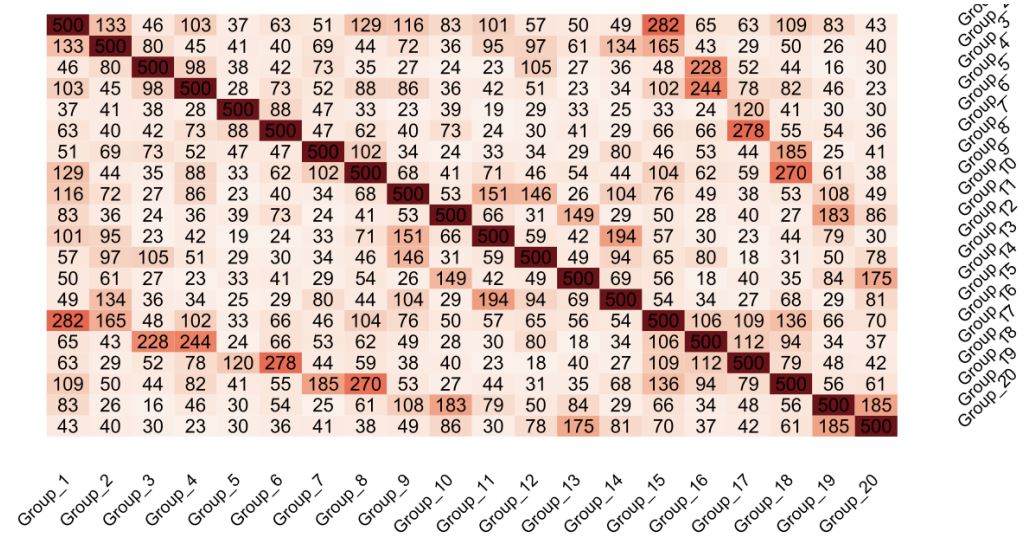
Figure 1: Heatmap illustrating gene overlaps post-statistical analysis: This heatmap visually represents the extent of gene
overlap between various groups, derived from our statistical analysis. The color gradient within the heatmap is indicative
of the overlap magnitude among the genes, with deeper shades signifying a greater number of overlapping genes across the
analyzed groups. The analysis focused on the top 500 genes from each group to ensure a comprehensive comparison, highlighting the intricate patterns of gene expression and interaction within the Wnt signaling pathway.
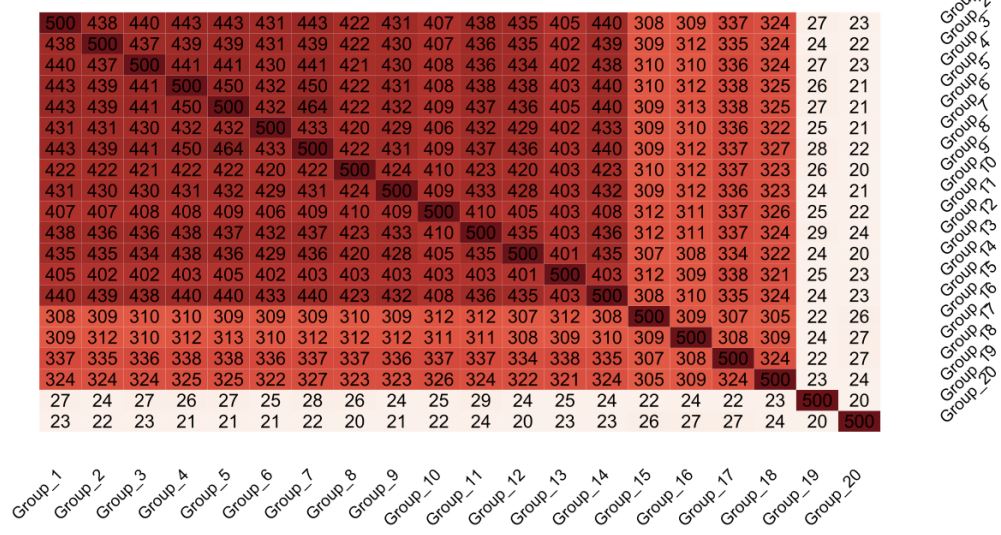
Figure 2: Heatmap displaying gene overlap post-machine learning analysis: This heatmap graphically depicts the gene overlap intensity across various groups as determined by our machine learning analysis. A color spectrum, with darker shades
of red indicating higher levels of gene overlap, visually conveys the comparative analysis of gene interactions. The selection
criteria for this heatmap involved concentrating on the top 500 genes from each group, ensuring a focused and detailed examination of gene overlap patterns within the context of machine learning insights.
Having generated a Heatmap based on statistical analysis we focused on utilizing machine learning for a similar data analysis. Diverging from the traditional statistical analysis, the machine learning approach utilizing Random Forest algorithms offered a distinct perspective on gene significance. This analysis underscored a substantially higher overlap between groups, especially notable between Group 1 and Group 2, revealing an impressive 438 out 500 genes overlap. Random Forest is basing the gene selection on specific characteristics and not in logFold change, so the genes in this analysis are sorted based on important features. This high gene overlap has a two-fold meaning. One interpetation is that the genes selected from the algorithm are housekeeping genes because the genetic pertrubations do not seem to affect them. Another interpatation is that there is a Wnt fail safe mechanism which kicks in when Wnt signalling components are damaged, and is able to keep acticve the known Wnt genes. There is no such mechanism identified so far. Nevertheless, this contrast arising from the two analysis methods highlights the advanced insights provided by machine learning (Figure 2). Nevertheless, the difference in the two maps generated from the two different analysis indicates the importance of combining various techniques for analyzing whole genome data.
We deemed important to generate some UpSet plots to better visualize specific group overlap. UpSet plots have emerged as a powerful visualization technique for elucidating the complex intersections among gene sets. UpSet plots are capable of displaying datasets with more than three intersecting sets, presenting intersections in a matrix format. In this matrix, rows correspond to the sets (or groups, in this context), and columns represent the intersections between these sets. Notably, for each row, cells that are part of an intersection are filled in. If multiple cells in a row are filled, they are connected with a line. Figures 3 and 4 showcase an UpSet plot utilizing the same data that were used for the heatmap.
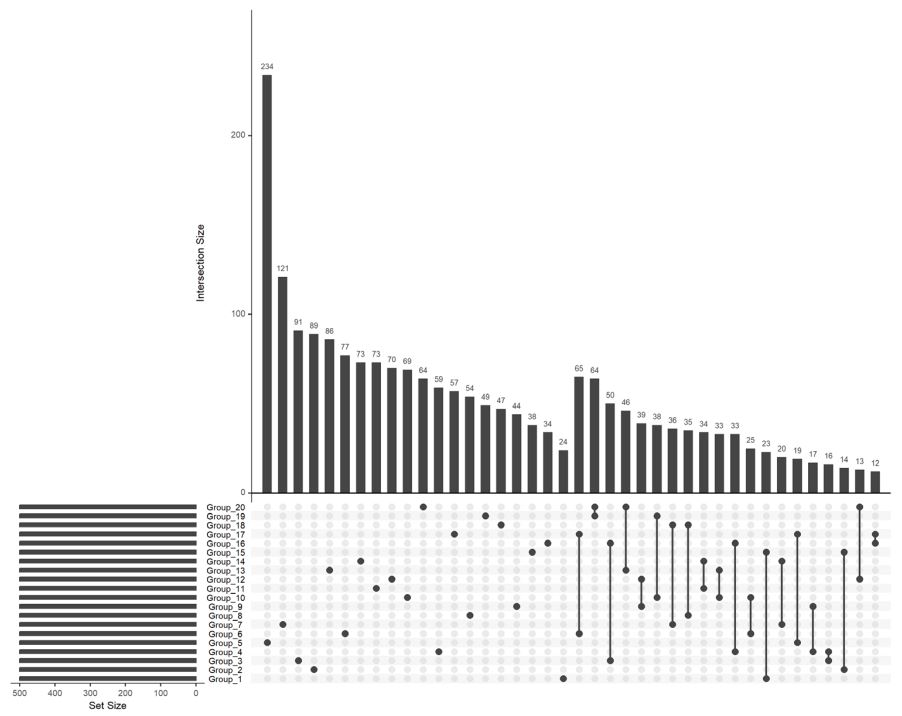
Figure 3: UpSet plot depicting gene overlaps following statistical analysis: This UpSet plot highlights key gene overlaps
among different groups, based on statistical analysis outcomes. It was constructed using the top 500 genes identified in each
group to accurately represent the primary gene overlaps observed across the studied groups.
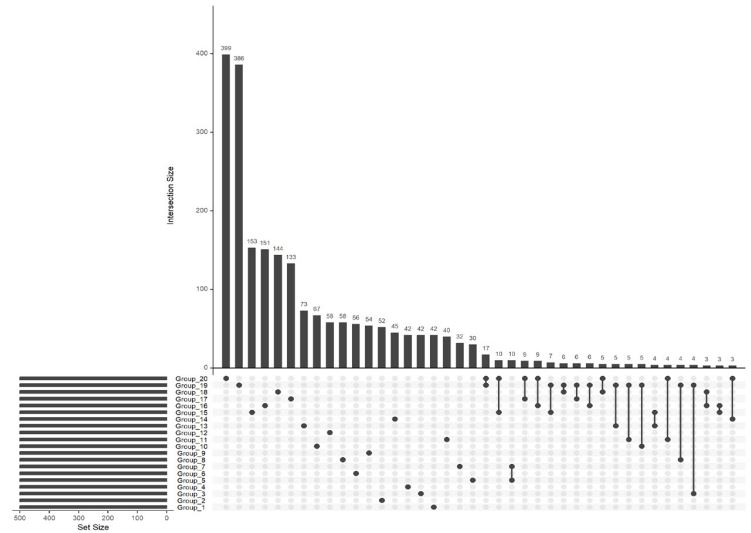
Figure 4: UpSet plot illustrating gene intersections post-machine learning analysis: This UpSet plot reveals the significant
intersections of genes across various groups, derived from machine learning evaluations. It utilizes the top 500 genes from
each group to map out the principal points of overlap, offering a detailed view of how these genes intersect across the analyzed group.
For better understanding of our data, we also incoporated Gene Ontology (GO) analysis to further enriched our analysis. G.O deriving from our statistical analysis identified L-serine biosynthesis as a critical biological process that the overlapping genes were involved in. We were able to highlight HSPA5 and HERPUD1 as the top hits. Those two genes have known functions in maintaining endoplasmic reticulum homeostasis. This emphasizes the resilience and essential functions of housekeeping genes under various stresses, including genetic manipulations and pathway activations. Machine learning-based G.O. analysis reaffirmed the Unfolded Protein Response’s (UPR) significance, particularly highlighting the PERKmediated pathway’s role in cellular homeostasis amidst genetic alterations and unveiling novel roles of transporter proteins in Wnt signaling (Table 2). This result suggests that the genes that are more active in our analysis are genes involved in housekeeping biological functions.
Table 2: Biological pathways and associated genes.
| Term | Adjusted PValue |
Genes | |
|---|---|---|---|
| 1 | PERK-mediated unfolded protein response (GO:0036499) | 3.641832e-04 | HSPA5;HERPUD1 |
| 2 | Integrated stress response signaling (GO:0140467) | 4.630147e-04 | HSPA5;HERPUD1 |
| 3 | Endoplasmic reticulum to cytosol transport (GO:1903513) | 4.630147e-04 | SEL1L;HERPUD1 |
| 4 | Response to endoplasmic reticulum stress (GO:0034976) | 1.335587e-07 | HSPA5;SEL1L;HYOU1;HERPUD1;PDIA4 |
| 5 | Retrograde protein transport, ER to cytosol (GO:0030970) | 5.137679e-04 | SEL1L;HERPUD1 |
| 6 | Protein exit from endoplasmic reticulum (GO:0032527) | 9.106201e-04 | SEL1L;HERPUD1 |
| 7 | Ubiquitin-dependent ERAD pathway (GO:0030433) | 3.242671e-04 | HSPA5;SEL1L;HERPUD1 |
| 8 | ERAD pathway (GO:0036503) | 3.641832e-04 | HSPA5;SEL1L;HERPUD1 |
| 9 |
Establishment of protein
localization to
extracellular region (GO:0044750) |
3.017672e-03 | SEL1L;PDIA4 |
| 10 | Response to unfolded protein (GO:0006986) | 3.083432e-03 | HSPA5;HERPUD1 |
Finally, we set up an ensemble approach, merging insights from both analyses. This led to consistently underscore the UPR as a paramount biological process, confirming the cell’s prioritization of survival mechanisms across various conditions. This convergence not only validates the experimental data but also openes new avenues for understanding the complex interactions and functionalities at the molecular level. Novel connections between amino acid transporters like SLC7A8 and SLC3A2 and cancer processes were unveiled, linking them to the observed Wnt signaling dysregulation in our experimental setups.
Our integrated analysis, combining traditional statistical methods with advanced machine learning techniques, unravels the complex biological responses to genetic manipulations and pathway activations. This approach provides a robust foundation for future research into the dynamic interplay of Wnt signaling with cellular functions and disease mechanisms, offering profound insights into the intricate machinery of biological systems. All Figures published here serve as comprehensive visual representations of our findings, illustrating the intricate gene expression patterns and overlaps across different conditions and treatments, providing a cohesive narrative of the nuanced regulation within the Wnt signaling pathway.
Discussion
In this study, we have embarked on a groundbreaking journey to dissect and elucidate the complexities of genomic datasets through an innovative integrated computational framework that seamlessly combines statistical analysis, machine learning, and ensemble approach. Our methodology, levereging on in-depth exploration of the Wnt signaling pathway, establishes a robust pipeline for understanding the nuanced regulation of gene expression influenced by genetic modifications and environmental factors. This computational framework’s strength lies in its unparalleled ability to unveil biologically significant insights, surpassing the capabilities of traditional analytical methods. By systematically categorizing the genomic dataset and employing differential expression analysis with the DESeq2 package, we have spotlighted genes that exhibit significant changes under various conditions, thereby identifying genes of potential biological importance essential for deciphering the dataset’s underlying patterns and trends.
Furthermore, the integration of machine learning analysis, especially through the Random Forest algorithm, has shed light on the significance of genes, revealing a considerable overlap in gene expression among different cell lines. This advanced understanding provided by machine learning is complemented by the enrichment analysis, which has pinpointed critical biological processes such as L-serine biosynthesis and the maintenance of endoplasmic reticulum homeostasis, effectively bridging our computational discoveries with tangible biological processes and mechanisms, and thus, significantly amplifying the impact of our study’s findings.
Our investigation has unveiled new insights into the universal response mechanisms to Wnt pathway activation, suggesting the possible existence of a global, fail-safe Wnt mechanism. Supported robustly by machine learning analysis, this discovery proposes that cells can activate a consistent gene response, even in the absence of key Wnt components, potentially through cellular components that substitute the functions of TCF and β-catenin. Moreover, the identification of crucial biological processes and molecular functions, including the unfolded protein response and the involvement of amino acid transporters like SLC7A8 and SLC3A2 [18,19], opens new avenues for understanding cellular responses to stress and pathway activations. These findings not only validate our experimental data but also pave the way for exploring the complex molecular interactions, particularly in relation to disease mechanisms such as cancer.
The discovery of novel connections between Wnt signaling and specific genes, including amino acid transporters, underscores the potential of these findings to inform the development of innovative therapeutic strategies. This highlights the critical role of Wnt signaling in various diseases, offering a valuable resource for future research aimed at elucidating the pathway’s role in disease mechanisms. We advocate for the continued integration of computational methods with experimental validation in future research endeavors, underscoring the invaluable nature of this approach in enhancing our understanding of biological systems. Our study serves as a blueprint for future genomic and molecular biology research, demonstrating the power of combining statistical analysis with machine learning to interpret complex genomic data.
Conclusion
In conclusion, our study shows that integrating statistical analysis, machine learning, and gene sorting methodologies, can be used to identified novel gene interactions and pathways of biological significance. These findings not only contribute to the current knowledge base but also open up potential targets for therapeutic intervention, particularly in cancer research. The insights gained from this study underscore the importance of integrating diverse analytical approaches to unravel the complexities of biological systems, paving the way for future research in the field.
References
- McMahon AP, Moon RT. Ectopic expression of the proto-oncogene int-1 in Xenopus embryos leads to duplication of the embryonic axis. Cell. 1989; 58(6): 1075-84.
- Fevr T, Robine S, Louvard D, Huelsken J. Wnt/β-Catenin Is Essential for Intestinal Homeostasis and Maintenance of Intestinal Stem Cells. Mol Cell Biol. 2007; 27(21): 7551-9.
- Rijsewijk F, Schuermann M, Wagenaar E, Parren P, Weigel D, et al. The Drosophila homology of the mouse mammary oncogene int-1 is identical to the segment polarity gene wingless. Cell. 1987; 50(4): 649-57.
- Taniguchi H, Yamamoto H, Hirata T, Miyamoto N, Oki M, et al. Frequent epigenetic inactivation of Wnt inhibitory factor-1 in human gastrointestinal cancers. Oncogene. 2005; 24(53): 7946-52.
- McWhirter JR, Neuteboom STC, Wancewicz EV, Monia BP, Downing JR, et al. Oncogenic homeodomain transcription factor E2APbx1 activates a novel WNT gene in pre-B acute lymphoblastoid leukemia. Proc Natl Acad Sci. 1999; 96(20): 11464-9.
- Huguet EL, McMahon JA, McMahon AP, Bicknell R, Harris AL. Differential expression of human Wnt genes 2, 3, 4, and 7B in human breast cell lines and normal and disease states of human breast tissue. Cancer Res. 1994; 54(10): 2615-21.
- Kennerdell JR, Carthew RW. Use of dsRNA-Mediated Genetic Interference to Demonstrate that frizzled and frizzled 2 Act in the Wingless Pathway. Cell. 1998; 95(7): 1017-26.
- Pinson KI, Brennan J, Monkley S, Avery BJ, Skarnes WC. An LDL-receptor-related protein mediates Wnt signalling in mice. Nature. 2000; 407(6803): 535-8.
- Van Amerongen R, Bowman AN, Nusse R. Developmental Stage and Time Dictate the Fate of Wnt/β-Catenin-Responsive Stem Cells in the Mammary Gland. Cell Stem Cell. 2012; 11(3): 387-400.
- Doumpas N, Lampart F, Robinson MD, Lentini A, Nestor CE, et al. TCF / LEF dependent and independent transcriptional regulation of Wnt/β‐catenin target genes. EMBO J. 2019; 38(2): e98873.
- Jiménez-Luna J, Grisoni F, Schneider G. Drug discovery with explainable artificial intelligence. Nat Mach Intell. 2020; 2(10): 573-84.
- Marblestone AH, Wayne G, Kording KP. Toward an Integration of Deep Learning and Neuroscience. Front Comput Neurosci. 2016. 10. http://journal.frontiersin.org/Article/10.3389/fncom.2016.00094/abstract.
- Ching T, Himmelstein DS, Beaulieu-Jones BK, Kalinin AA, Do BT, et al. Opportunities and obstacles for deep learning in biology and medicine. J R Soc Interface. 2018; 15(141): 20170387.
- Greener JG, Kandathil SM, Moffat L, Jones DT. A guide to machine learning for biologists. Nat Rev Mol Cell Biol. 2022; 23(1): 40-55.
- Love MI, Huber W, Anders S. Moderated estimation of fold change and dispersion for RNA-seq data with DESeq2 Genome Biology. 2014; 15(12): 550.
- Kuhn, M. Building Predictive Models in R Using the caret Package. Journal of Statistical Software. 2008; 28(5): 1-26. https://doi.org/10.18637/jss.v028.i05.
- Paplomatas P, Krokidis MG, Vlamos P, Vrahatis AG. An Ensemble Feature Selection Approach for Analysis and Modeling of Transcriptome Data in Alzheimer’s Disease. Appl. Sci. 2023; 13: 2353. https://doi.org/10.3390/app13042353.
- Fotiadis D, Kanai Y, Palacín M. The SLC3 and SLC7 families of amino acid transporters. Molecular aspects of medicine. 2013; 34(2-3): 139-158.
- Sikder MO, Sivaprakasam S, Brown TP, Thangaraju M, Bhutia YD, et al. SLC6A14, a Na+/Cl−-coupled amino acid transporter, functions as a tumor promoter in colon and is a target for Wnt signaling. Biochemical Journal. 2020; 477(8): 1409-1425.