
Open Access, Volume 10
Prevalence and correlates of Covert Contraceptives’ Use (CCU) in Kenya, Nigeria and Uganda: Evidence from Consumer Market for Family Planning (CM4FP) cross-sectional household survey of 2019-2020
Jefferson Mwaisaka1,2*; Collins Mudogo3
1School of Public Health, University of Ghana, Accra, Ghana.
2International Centre for Reproductive Health-Kenya.
3Division of Health Information and Research, County Government of Vihiga, Kenya.
Jefferson Mwaisaka
School of Public Health, University of Ghana, Accra, Ghana.
Email: jeffmwaisaka@gmail.com
Received : Jan 22, 2024,
Accepted : Mar 18, 2024
Published : Mar 20, 2024,
Archived : www.jclinmedcasereports.com
Abstract
Background: Male involvement in family planning can address unmet needs for contraception. Despite this, many women in sub-Saharan Africa use modern contraceptives without their male partner’s knowledge. Using data from the Consumer’s Market for Family Planning (CM4FP) survey, this study examined the prevalence and correlates of Covert Contraceptives’ Use (CCU) in Kenya, Nigeria, and Uganda.
Methods: We included CM4FP respondents who reported to have a partner and were using modern contraceptives at the time of data collection. A total of 4,652 women aged 18-49 were studied (Kenya 1,888; Nigeria 1,463; Uganda 1,301). Several covariates were analyzed as potential predictors of CCU. These covariates were significant at p≤0.05. Mixed effect logistic regression model was employed to control for variations within and between regions in a country.
Results: The prevalence of CCU in Kenya, Nigeria and Uganda was 11% (95% CI: 10-13), 12% (95% CI: 10-14) and 16% (95% CI: 14-18) respectively. In Kenya, the odds of CCU increased among Muslim women (aOR=2.04, 95% CI: 1.22-3.41) and traditional religious women (aOR=1.70, 95% CI: 1.23-2.33) compared to Christian women. University education (aOR=0.16, 95% CI: 0.04-0.62), having been pregnant at least once excluding any pregnancies (aOR=0.36, 95% CI: 0.18-0.73) and high Poverty Probability Index (PPI) scores (aOR=0.16, 95% CI: 0.04-0.72) decreased the odds of being a CCU. In Nigeria, the odds of CCU increased among women who reported to have primary education level (aOR=2.55, 95% CI: 1.17-5.54) compared to those who never attended school and among those who were not sure if they wanted children in future or not (aOR=1.92 95% CI: 1.06-3.48) compared to those who did not want children in future. In Uganda, the odds of CCU increased among women who reported having children aged 5 years and above aOR=2.29, 95% CI: 1.37-3.83) compared to those with under one year. Like Kenya, having a university education was found to be associated with reduced CCU odds (aOR=0.25, 95% CI: 0.08-0.78) compared to those who never attended school in Uganda.
Conclusion: This study confirms the existence of CC users and the factors associated with covert use in all the three countries. There is need for policy makers and the public health community to adopt flexible and sustainable strategies to address factors associated with CC users while improving couple contraception communication without compromising on women contraceptive autonomy.
Keywords: Covert; Contraceptive; Kenya; Nigeria; Uganda.
Copy right Statement: Content published in the journal follows Creative Commons Attribution License (http://creativecommons.org/licenses/by/4.0). © Mwaisaka J (2024)
Journal: Open Journal of Clinical and Medical Case Reports is an international, open access, peer reviewed Journal mainly focused exclusively on the medical and clinical case reports.
Citation: Mwaisaka J, Mudogo C. Prevalence and correlates of Covert Contraceptives’ Use (CCU) in Kenya, Nigeria and Uganda: Evidence from Consumer Market for Family Planning (CM4FP) cross-sectional household survey of 2019-2020. Open J Clin Med Case Rep. 2024; 2214.
Background
Family Planning (FP) has for long been regarded as both a marker and a potential driver of women’s autonomy and overall population health [1]. Ensuring access to contraceptive methods for all women of reproductive age is vital for the good-health, social well-being and autonomy of women [2]. In Sub-Saharan Africa (SSA), patriarchal views play a significant role in contraceptives acceptance and uptake. Within SSA, cultural factors coupled with existing socially constructed gendered roles have been associated with women lack of autonomy to make their own fertility decisions about using FP methods. These patriarchal settings give men the power to not only decide on the family size [3] but also whether their female partners should use contraceptives or not. In many settings, young women in particular are often coerced by partners and families into making fertility decisions against their will, mostly termed as “reproductive coercion” [1]. Contraceptives related partner communication is therefore central to reproductive health decision-making including contraceptive use and related sexual needs. Partner communication about family planning has been associated with an increased likelihood of contraception use and even with future intention to use contraception among non-contraception couples [4]. In Kenya for instance, partner involvement is a key strategy for addressing about 17.5% of unmet needs of contraceptives [5]. In Nigeria, contraceptive use is significantly influenced by spousal communication about family planning [6]. Certainly, improved contraceptive knowledge by male partners has the potential to promote cooperation particularly on the methods requiring male involvement like condoms [5]. Inspite of the social and health benefits associated with contraceptives related partner communication, a significant number of women in sub-Saharan Africa use modern contraceptives without their partners’ knowledge (covertly) [7-9].
Covert Contraceptive Use (CCU) is the use of contraceptive methods without the woman partner’s knowledge. Use of covert methods shifts control to the woman rather than the relationship allowing for women to assert their fertility desires and intentions [10,11]. Several factors could influence women’s covert contraceptives’ use including gender dynamics and the wider socioeconomic and cultural aspects, misperceptions of partners’ views of contraceptive use, desired family size and fear of reprisal from the partner [1,5,12]. If discovered, CCU may expose women especially adolescents girls and young women to genderbased violence [11,13,14] further resulting in contraceptive discontinuation [15,16] or even change to a less effective and/or preferred method [17] hence negatively affecting the gains made in increasing the contraceptive prevalence rates. Studies have also shown that women often opt to use contraceptives covertly due to non-supportive spouses and relatives [3,18]. The drivers of CCU vary by settings, in Nigeria for example; a woman may elect to be a CCU because of her partner’s disapproval of contraceptive use, his pronatalist attitude, failure to discuss with him, or difficulty in communicating with him about contraception. Moreover, a Nigerian woman may opt for covert contraceptive use because her partner does not provide economic support for his household [14]. In Kenya, fear of side effects and perceived infidelity among women using contraceptives, misconceptions and socio-cultural concerns on FP are some of the reasons for male opposition to FP use [5] sometimes resulting to CCU. In Uganda, women prefer to be covert users of contraceptives due to discordant fertility desires, negative perceptions towards contraceptives’ use and familial pressure to reproduce [10]. Indeed, an effect of CCU could be that women might secretly source for contraceptives from non-clinical establishments thereby jeopardizing their health. An additional concern about non-clinical establishments as sources of contraceptives is the associated reduced visits to clinicians translating to a reduction in routine preventive screening (including for Pap smears, pelvic exams, clinical breast exams and screening for sexually transmitted infections) [2].
While determinants of CCU have been documented, CCU prevalence is not routinely estimated and monitored by family planning programs [8]. It is imperative for family planning programs to be aware of CCU prevalence and design interventions to improve couple communication while meeting the reproductive needs of women who enjoy covert contraceptive use. Further, providers can help covert users achieve their personal reproductive goals by providing high-quality, client-centered contraceptive counseling [19].
Materials and Methods
Data sources and study population: We used data from Consumer’s Market for Family Planning (CM4FP) survey conducted in Kenya, Nigeria & Uganda between 2019 and 2020 [20]. Briefly, the CM4FP survey had three objectives. The first objective was to test a ring-fenced census approach consisting of an outlet census in a defined geographical area and a household survey in a smaller inner ring to comprehensively map the total FP market in a local geography. The second objective was to explore FP supply market dynamism through longitudinal data collection from contraceptive outlets. The third and last objective was to test a methodology for directly linking household and outlet data to measure the relationship between contraceptive demand and supply. Longitudinal outlet census data and repeated cross-sectional household survey data from women aged 18-49 were collected at three quarterly time points in Kenya and Nigeria, and two in Uganda. Outlets were in an outer ring geography to encompass locations likely visited by women sampled from a smaller inner ring. Data from women who received a contraceptive method in the past 12 months was linked to data for the outlet from which they received the method. Details of the CM4FP survey have been published elsewhere [20].
For this study, we limited our analysis to respondents who reported to have a partner and were using modern contraceptive at the time of data collection or 12 months preceding the survey. Covert contraceptive users in this study were women who reported to be using modern contraceptives without their partner’s knowledge. Sample for this study was 4,652 (Kenya 1,888; Nigeria 1,463; Uganda 1,301).
Measures: There are two main approaches to measure CCU in a cross-sectional survey. First is a direct question, “Does your husband/partner know that you are using a method of family planning?” Second is an indirect method: the reports of both partners to the question on contraceptive use are matched, and if the woman reports a modern contraceptive method and the male partner reports nonuse, her use is considered covert [8]. This study used a direct method using the question “Does your husband/partner know that you are using [CURRENT METHOD]?” The outcome variable for this study was covert use of modern contraceptives among women who reported to have a partner and were using modern contraceptive at the time of data collection or 12 months preceding the survey. Covariates analyzed as potential predictors of CCU included; age, education level, religion, marital status, ever pregnant, ever given birth, parity, number of children, age of the youngest child, fertility intentions and poverty probability index scores. These covariates were significant at p≤0.05. Mixed effect logistic regression model was employed to control for variations within and between regions in a country. Data was analyzed using STATA version 14.
Ethical approval: In Kenya, Population Services International (PSI) Research Ethics Board (01.2019 and 04.2019), the AMREF Ethics & Scientific Review Committee in Kenya (P615-2019) provided ethical approval. In Nigeria, the National Health Research Ethics Committee of Nigeria (NHREC/01/01/2007-27/05/2019) provided ethical approval. Uganda ethical approval was provided by the Uganda National Council for Science and Technology review board (SS 5041 and SS 5104), and the Mildmay Uganda Research Ethics Committee (1105-2019). Informed consent was obtained from all respondents prior to conducting the study. To protect the identity of participants, consent was obtained orally, except in Uganda where consent was written as mandated by the in-country review board [20].
Results
The CM4FP survey interviewed 11,536 female respondents aged between 18-49. For this study we included 4,652 (Kenya 1,888; Nigeria 1,463; Uganda 1,301) who reported to have a partner and were recent users of modern contraceptives (Figure 1).
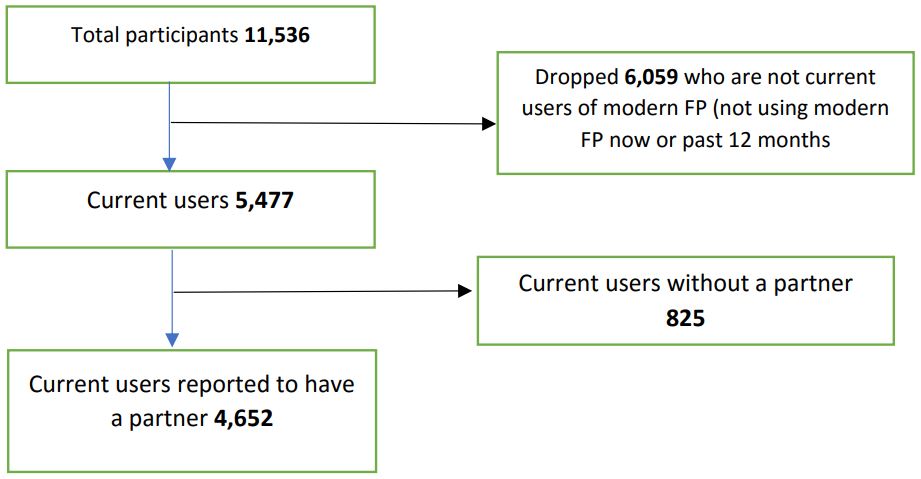
Figure 1: Drawings in 6 to 9 months after UCBC therapy.
We dropped 6,059(52.52%) of the total respondents who were not current users of contraceptives and a further 827(7.17%) current users but reported not to be having a partner. Of the 1,888 eligible study participants in Kenya, 25-29-year-olds were the majority at 29.18%. Similarly, in Uganda, of the 1,301 eligible respondents, 25-29-year-olds were the majority at 32.67% while in Nigeria 35-39-year-olds were the majority, 25.02% (Table 1). Christianity was the major religion for Kenya (54.08%), Nigeria (52.90%) and Uganda (81.01%). Majority of the respondents in Nigeria and Uganda had secondary education as their highest level of education at 43.40% and 40.05% respectively while Kenya’s respondents had primary level education as their highest level, 36.44%. In all the three countries, more than 90% of all the respondents had ever been pregnant with majority of Kenyan and Nigerian respondents reporting to be having two children (Kenya 27.54%, Nigeria 21.26%) and Uganda one child (26.21%). On future fertility intentions, majority of the respondents in Nigeria (38.69%) did not want children in future while in Kenya 36.06% and Uganda, 43.66% reported that they would like to have children after two years. On PPI score (likelihood that a household is living below poverty line) all the three countries had majority scoring 61 and above. Table 1 below summarizes the participants’ demographic profiles.
Table 1: Respondents’ demographic profiles.
| Kenya (n=1,888) | Nigeria (n=1,463) | Uganda (n=1,301) | |
|---|---|---|---|
| Age | |||
| 18-19 | 34(1.80%) | 9(0.62%) | 51(3.92%) |
| 20-24 | 439(23.25%) | 161(11%) | 344(26.44%) |
| 25-29 | 551(29.18%) | 270(18.46) | 425(32.67%) |
| 30-34 | 402(21.29%) | 303(20.71%) | 227(17.45%) |
| 35-39 | 270(14.30%) | 366(25.02%) | 147(11.30%) |
| 40-44 | 139(7.36%) | 229(15.65%) | 74(5.69%) |
| 45-49 | 53(2.81%) | 125(8.54%) | 33(2.54%) |
| Primary respondent education level | |||
| Never attended school | 52(2.75%) | 119(8.13%) | 32(2.46%) |
| Primary level | 688(36.44%) | 147(10.05%) | 450(34.59%) |
| Post - primary level/vocational | 44(2.33) | ||
| Secondary | 591(31.30%) | 635(43.40%) | 521(40.05%) |
| College/Mid-level | 389(20.60%) | 188(12.85%) | 148(11.38%) |
| University | 123(6.51%) | 374(25.56%) | 148(11.38%) |
| Religion | |||
| Christian | 1021(54.08%) | 774(52.90%) | 1054(81.01%) |
| Muslim | 177(9.38%) | 682(46.62%) | 196(15.07%) |
| Other | 690(36.55) | 7(0.48%) | 51(3.92%) |
| Marital status | |||
| Currently married | 1503(79.61) | 1400(95.69%) | 554(42.58%) |
| Living with a man | 220(11.65%) | 16(1.09%) | 526(40.43%) |
| Not married or living with a man | 130(6.89%) | 38(2.60%) | 180(13.84%) |
| Widowed or divorced | 35(1.85%) | 9(0.62%) | 41(3.15%) |
| Ever pregnant | |||
| Yes | 1761(93.27%) | 1417(96.86%) | 1203(92.47%) |
| No | 127(6.73%) | 46(3.14%) | 98(7.53%) |
| Ever given birth | |||
| Yes | 1736(91.95%) | 1399(95.63%) | 1161(89.24%) |
| No | 152(8.05%) | 64(4.37%) | 140(10.76%) |
| Pregnancies excluding current pregnancy | |||
| None | 139(7.36%) | 63(4.31%) | 111(8.53) |
| Once | 471(24.95%) | 120(8.20%) | 299(22.98) |
| Twice | 498(26.38%) | 242(16.54%) | 277(21.29) |
| Thrice | 326(17.27%) | 237(16.20%) | 208(15.99) |
| Four and more times | 454(24.05%) | 801(54.75%) | 406(31.21) |
| Number of children | |||
| None | 17(0.90%) | 69(4.72%) | 145(11.15%) |
| One child | 488(25.85%) | 154(10.53%) | 341(26.21%) |
| Two children | 520(27.54%) | 311(21.26) | 288(22.14%) |
| Three children | 316(16.74%) | 295(20.16%) | 211(16.22%) |
| Four children | 187(9.90%) | 261(17.84%) | 136(10.45%) |
| Five children | 119(6.30%) | 198(13.53%) | 91(6.99%) |
| Six and more children | 89(4.71%) | 175(11.96%) | 89(6.84%) |
| Age of youngest child in years | |||
| Under 1 year | 250(14.54%) | 285(20.44%) | 224(19.38%) |
| One year | 301(17.51%) | 258(18.51%) | 250(21.63%) |
| Two years | 250(14.54%) | 212(15.21%) | 167(14.45%) |
| Three years | 222(12.91%) | 129(9.25%) | 140(12.11%) |
| Four Years | 155(9.02%) | 101(7.25%) | 94(8.13%) |
| Five years and above | 541(31.47%) | 409(29.34%) | 281(24.31%) |
| Fertility intentions | |||
| Don't want children in future | 606(32.14%) | 566(38.69%) | 286(21.98%) |
| Not sure | 143(7.58%) | 106(7.25%) | 80(6.15%) |
|
Would like to have children
in 1-2 years' time |
352(18.66%) | 405(27.68) | 312(23.98%) |
|
Would like to have child/ren
after 2 years |
680(36.06%) | 321(21.94%) | 568(43.66%) |
| Don't know when to have child/ren | 92(4.88%) | 56(3.83%) | 49(3.77% |
| Can't get pregnant | 13(0.69%) | 9(0.62%) | 6(0.46%) |
| PPI Score | |||
| Between 5-20 | 8(0.42) | 0 | 8(0.61%) |
| Between 21-40 | 85(4.51%) | 76(5.19%) | 81(6.23%) |
| Between 41-60 | 269(14.26) | 440(30.08%) | 226(17.37%) |
| 61 and above | 1524(80.81) | 947(64.73%) | 986(75.79%) |
Covert Contraceptive Use (CCU) prevalence
The overall prevalence of CCU in Kenya was 11% (95% CI: 10-13), Nigeria was 12% (95% CI: 10-14) and Uganda 16% (95% CI: 14-18). Table 2 below summarizes the CCU prevalence of the three countries by selected background characteristics.
Table 2: Prevalence of Covert Contraceptive Use by selected background characteristics for each country.
| Respondents’ characteristics | Kenya (n=211) | Nigeria (n=172) | Uganda (n=206) |
|---|---|---|---|
| Age | |||
| 18-19 | 2(0.95%) | 1(0.58%) | 12(5.83%) |
| 20-24 | 44(20.85%) | 32(18.60%) | 52(25.24%) |
| 25-29 | 59(27.96%) | 32(18.60%) | 60(29.13%) |
| 30-34 | 40(18.96%) | 27(15.70%) | 39(18.93%) |
| 35-39 | 39(18.48%) | 38(22.09%) | 27(13.11%) |
| 40-44 | 19(9.00%) | 20(11.63%) | 12(5.83%) |
| 45-49 | 8(3.79%) | 22(12.79%) | 4(1.94%) |
| Primary respondent education level | |||
| Never attended school | 9(4.27%) | 14(8.14%) | 7(3.40%) |
| Primary level | 106(50.24%) | 27(15.70%) | 87(42.23%) |
| Post - primary level / vocational | 10(4.74%) | ||
| Secondary | 58(27.49%) | 84(48.84%) | 82(39.81%) |
| College / Mid-level | 24(11.37%) | 19(11.05%) | 13(6.31%) |
| University | 4(1.90%) | 28(16.28%) | 17(8.25%) |
| Religion | |||
| Christian | 91(43.13%) | 79(45.93%) | 159(77.18%) |
| Muslim | 28(13.27%) | 93(54.07%) | 42(20.39%) |
| Other | 92(43.60%) | 0(0.00%) | 5(2.43%) |
| Marital status | |||
| Currently married | 132(62.56%) | 148(86.05%) | 58(28.16%) |
| Living with a man | 40(18.96%) | 3(1.74%) | 88(42.72%) |
| Not married or living with a man | 27(12.80%) | 17(9.88%) | 49(23.79%) |
| Widowed or divorced | 12(5.69%) | 4(2.33%) | 11(5.34%) |
| Ever pregnant | |||
| Yes | 196(92.89%) | 156(90.70%) | 192(93.20%) |
| No | 15(7.11%) | 16(9.30%) | 14(6.80%) |
| Ever given birth | |||
| Yes | 191(90.52%) | 153(88.95%) | 182(88.35%) |
| No | 20(9.48%) | 19(11.05%) | 24(11.65%) |
| Pregnancies excluding current pregnancy | |||
| None | 19(9.00%) | 18(10.47%) | 19(9.22%) |
| Once | 35(16.59%) | 15(8.72%) | 45(21.84%) |
| Twice | 48(22.75%) | 18(10.47%) | 44(21.36%) |
| Thrice | 39(18.48%) | 29(16.86%) | 35(16.99%) |
| Four and more times | 70(33.18) | 92(53.49%) | 63(30.58%) |
| Number of children | |||
| None | 0(0.00%) | 20(11.63%) | 24(11.65%) |
| One child | 40(18.96%) | 16(9.30%) | 58(28.16%) |
| Two children | 51(24.17%) | 31(18.02%) | 48(23.30%) |
| Three children | 34(16.11%) | 27(15.70%) | 30(14.56%) |
| Four children | 25(11.85%) | 31(18.02%) | 19(9.22%) |
| Five children | 20(9.48%) | 18(10.47%) | 13(6.31%) |
| Six and more children | 21(9.95%) | 29(16.86%) | 14(6.80%) |
| Age of youngest child in years | |||
| Under 1 year | 27(14.14%) | 31(20.39%) | 24(13.19%) |
| One year | 26(13.61%) | 30(19.74%) | 33(18.13%) |
| Two years | 21(10.99%) | 27(17.76%) | 24(13.19%) |
| Three years | 32(16.75%) | 10(6.58%) | 24(13.19%) |
| Four Years | 15(7.85%) | 10(6.58%) | 13(7.14%) |
| Five years and above | 70(36.65%) | 44(28.95%) | 64(35.16%) |
| Fertility intentions | |||
| Don't want children in future | 84(39.81%) | 57(33.14%) | 44(21.36%) |
| Not sure | 22(10.43%) | 19(11.05%) | 12(5.83%) |
| Would like to have children in 1-2 years' time | 34(16.11%) | 47(27.33%) | 56(27.18%) |
| Would like to have child/ren after 2 years | 63(29.86%) | 41(23.84%) | 80(38.83%) |
| Don't know when to have child/ren | 7(3.32%) | 8(4.65%) | 12(5.83%) |
| Can't get pregnant | 1(0.47%) | 0(0.00%) | 2(0.97%) |
| PPI score | |||
| Between 5-20 | 4(1.90%) | 0(0.00%) | 0(0.00%) |
| Between 21-40 | 14(6.64%) | 15(8.72%) | 18(8.74%) |
| Between 41-60 | 46(21.80%) | 57(33.14%) | 35(16.99%) |
| 61 and above | 147(69.67%) | 100(58.14%) | 153(74.27%) |
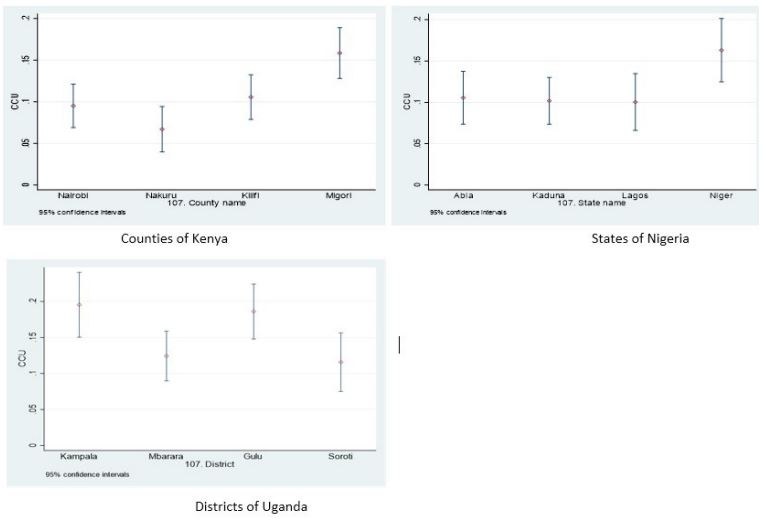
Figure 2: Graphs showing CCU prevalence by regions in each country.
CCU prevalence by regions in each country
The overall prevalence of CCU in Kenya was 11% (95% CI: 10-13) with Migori county having the highest prevalence of approximately 16% (95% CI: 13-19) followed by Kilifi at 11% (95% CI: 8-14), Nairobi was third with 10% (95% CI: 7-12) and Nakuru reported the lowest CCU prevalence in Kenya, 7% (95% CI: 4-10). Nigerian overall CCU prevalence was 12% (95% CI: 10-14). Niger state reported the highest prevalence of CCU, 16% (95% CI: 13-20), followed by Abia state 11% (95% CI: 8-14). Kaduna (95% CI: 8-13) and Lagos (95% CI: 7-14) had equal CCU prevalence at 10% each. Among the three countries, Uganda reported the highest level of CCU, 16% (95% CI: 14-18) with varied levels across the four districts as shown in Figure 2. In Uganda, Kampala, the capital city, had the highest prevalence of almost 20% (95% CI: 15-24), followed closely by Gulu district 19% (95 CI: 15-23). Mbarara district in Uganda had a prevalence of 12% (95% CI: 9-16), while the lowest CCU prevalence was reported in Soroti district 11% (95% CI: 8-16). In all the three countries, the regional differences were not statistically significant.
Table 3: Unadjusted and adjusted factors associated with covert contraceptive use in Kenya, Nigeria and Uganda.
| KENYA | NIGERIA | UGANDA | ||||||||||
|---|---|---|---|---|---|---|---|---|---|---|---|---|
| Crude OR 95% CI |
P-Values | Adjusted OR 95%CI |
P - Values | Crude OR 95% CI |
P - Values | Adjusted OR 95%CI |
P - Values | Crude OR 95% CI | P - Values | Adjusted OR 95% CI |
P - Values | |
| Age | ||||||||||||
| 18-19 | 1.00 | 1.00 | 1.00 | |||||||||
| 20-24 | 1.88 (0.43-8.15) |
0.4 | 2.06 (0.25-17.14) |
0.5 | 0.57 (0.28-1.16) | 0.12 | ||||||
| 25-29 | 2.10 (0.49-9.00) |
0.32 | 1.11 (0.13-9.24) |
0.92 | 0.50 (0.25-1.02) | 0.06 | ||||||
| 30-34 | 1.86 (0.42-8.07) |
0.41 | 0.82 (0.1-6.86) | 0.86 | 0.63 (0.30-1.32) | 0.22 | ||||||
| 35-39 | 2.93 (0.67-12.77) |
0.15 | 0.90 (0.12-8.24) |
0.1 | 0.69 (0.32-1.50) | 0.35 | ||||||
| 40-44 | 2.74 (0.60-12.45) |
0.19 | 0.81 (0.10-6.90) |
0.85 | 0.61 (0.25-1.50) | 0.29 | ||||||
| 45-49 | 3.09 (0.61-15.64) |
0.17 | 1.86 (0.22-15.79) |
0.57 | 0.46 (0.13-1.57) | 0.22 | ||||||
| Respondents’ Education level | ||||||||||||
| Never attended school | 1.00 | 1.00 | 1.00 | |||||||||
| Primary level | 0.75 (0.35-1.63) |
0.47 | 2.12 (1.01-4.48) |
0.05 | 2.55 (1.17 - 5.54) |
0.02 | 0.76 (0.31-1.84) | 0.54 | ||||
|
Post - primary level / vocational |
1.31 (0.47-3.67) |
0.61 | ||||||||||
| Secondary | 0.46 (0.21-1.03) |
0.06 | 1.39 (0.72-2.66) |
0.32 | 0.50 (0.20-1.24) | 0.14 | ||||||
| College / Mid-level | 0.29 (0.12-0.67) |
<0.01 | 0.96 (0.45-2.02) |
0.91 | 0.37 (0.13-0.99) | 0.06 | ||||||
| University | 0.15 (0.04-0.53) |
<0.01 | 0.72 (0.34-1.50) |
0.38 | 0.25 (0.09-0.71) | 0.01 | 0.25 (0.08-0.78) |
0.02 | ||||
| Religion | ||||||||||||
| Christian | 1.00 | 1.00 | 1.00 | |||||||||
| Muslim | 2.3 (1.40-3.78) |
<0.01 | 2.04 (1.22-3.41) |
<0.01 | 1.41 (0.97-2.06) |
0.07 | 1.42 (0.94-2.14) | 0.09 | ||||
| Traditional | 1.65 (1.21-2.25) |
<0.01 | 1.70 (1.23-2.33) |
<0.01 | 0.54 (0.21-1.41) | 0.21 | ||||||
| Ever Pregnant | ||||||||||||
| Yes | 1.00 | 1.00 | 1.00 | |||||||||
| No | 1.37 (0.76-2.47) |
0.29 | 4.86 (2.55-9.23) |
<0.01 | 0.89 (0.49-1.59) | 0.49 | ||||||
| Pregnancies excluding current pregnancy | ||||||||||||
| None | 1.00 | 1.00 | 1.00 | |||||||||
| Once | 0.45 (0.25-0.84) |
0.01 | 0.35 (0.18-0.66) |
<0.01 | 0.30 (0.14-0.67) |
<0.01 | 0.84 (0.47-1.52) | 0.56 | ||||
| Twice | 0.58 (0.32-1.05) |
0.07 | 0.35 (0.18-0.66) |
<0.01 | 0.18 (0.09-0.38) |
<0.01 | 0.91 (0.50- 1.64) | 0.74 | ||||
| Thrice | 0.72 (0.39-1.32) |
0.29 | 0.37 (0.19-0.74) |
<0.01 | 0.32 (0.16-0.63) |
<0.01 | 0.94 (0.51-1.75) | 0.85 | ||||
| Four and more times | 0.89 (0.49-1.60) |
0.69 | 0.36 (0.18-0.73) |
<0.01 | 0.28 (0.15-0.52) |
<0.01 | 0.90 (0.51-1.58) | 0.7 | ||||
| Number of children | ||||||||||||
| None | 1.00 | 1.00 | 1.00 | |||||||||
| One child | 0.61 (0.34-1.09) |
0.1 | 0.26 (0.12-0.55) |
<0.01 | 1.02 (0.61-1.73) | 0.93 | ||||||
| Two children | 0.72 (0.41-1.27) |
0.26 | 0.25 (0.13-0.49) |
<0.01 | 0.98 (0.57-1.69) | 0.95 | ||||||
| Three children | 0.77 (0.42-1.41) |
0.39 | 0.23 (0.12-0.45) |
<0.01 | 0.80 (0.45-1.45) | 0.46 | ||||||
| Four children | 0.95 (0.49-1.83) |
0.88 | 0.31 (0.16-0.59) |
<0.01 | 0.79 (0.41-1.53) | 0.49 | ||||||
| Five children | 1.20 (0.59- 2.44) |
0.61 | 0.23 (0.11-0.47) |
<0.01 | 0.89 (0.42-1.85) | 0.75 | ||||||
| Six and more children | 1.81 (0.88-3.72) |
0.11 | 0.42 (0.21-0.84) |
0.01 | 1.07 (0.50-2.27) | 0.86 | ||||||
| Age of the youngest child in years | ||||||||||||
| Under 1 year | 1.00 | 1.00 | 1.00 | |||||||||
| One year | 0.75 (0.42-1.32) |
0.31 | 1.10 (0.64-1.87) |
0.74 | 1.27 (0.72-2.23) | 0.41 | ||||||
| Two years | 0.76 (0.42-1.38) |
0.37 | 1.23 (0.71-2.15) |
0.46 | 1.44 (0.78-2.65) | 0.24 | ||||||
| Three years | 1.36 (0.78-2.35) |
0.28 | 0.72 (0.34-1.53) |
0.4 | 1.63 (0.88-3.01) | 0.12 | ||||||
| Four Years | 0.88 (0.45-1.71) |
0.7 | 0.94 (0.44-1.99) |
0.86 | 1.26 (0.61-2.60) | 0.53 | ||||||
| Five years and above | 1.25 (0.78-2.00) |
0.36 | 1.10 (0.66-1.82) |
0.72 | 2.43 (1.46-4.04) | <0.01 | 2.29 (1.37-3.84) |
<0.01 | ||||
| Fertility intentions | ||||||||||||
|
Don't want children in future |
1.00 | 1.00 | 1.00 | |||||||||
| Not sure | 1.25 (0.74-2.10) |
0.41 | 1.84 (1.03-3.28) |
0.04 | 1.92 (1.06-3.48) |
0.03 | 0.95 (0.47-1.91) | 0.89 | ||||
|
Would like to have children in 1-2 years' time |
0.71 (0.46-1.09) |
0.11 | 1.14 (0.76-1.72) |
0.53 | 1.18 (0.76-1.83) | 0.45 | ||||||
|
Would like to have child/ ren after 2 years |
0.64 (0.45-0.91) |
0.01 | 1.29 (0.83-1.99) |
0.26 | 0.89 (0.60-1.33) | 0.58 | ||||||
|
Don't know when to have child/ren |
0.55 (0.25-1.25) |
0.15 | 1.47 (0.66-3.28) |
0.34 | 1.70 (0.82-3.54) | 0.15 | ||||||
| Can't get pregnant | 0.43 (0.55-3.41) |
0.43 | 1.00 | 2.64 (0.47-15.02) | 0.27 | |||||||
| PPI Score | ||||||||||||
| Between 5-20 | 1.00 | 1.00 | 1.00 | |||||||||
| Between 21-40 | 0.20 (0.05-0.92) |
0.04 | 0.20 (0.04 -0.92) |
0.04 | 1.00 | 2.70 (1.26-5.79) | 0.1 | |||||
| Between 41-60 | 0.22 (0.05-0.91) |
0.04 | 0.22 (0.05-0.10) |
0.05 | 0.63 (0.33-0.19) |
0.16 | 1.20 (0.78-1.86) | 0.41 | ||||
| 61 and above | 0.13 (0.03-0.52) |
<0.01 | 0.16 (0.04-0.72) |
0.02 | 0.51 (0.27-0.95) |
0.03 | ||||||
Covariates associated with CCU in the three countries were separately analyzed using logistic regression models. These covariates were significant at p≤0.05. In the bivariate analysis for Kenya, religion, fertility intentions (wanting or not wanting more children in future), number of pregnancies, poverty probability index score and respondents’ education level were CCU predictors. After adjusting for covariates, the odds of CCU increased among Muslim women (aOR=2.04, 95% CI: 1.22-3.41) and those reporting to be from a traditional religion (aOR=1.70, 95% CI: 1.23-2.33). Additionally, in Kenya, University education (aOR=0.16, 95% CI: 0.04-0.62), having being pregnant at least once excluding any pregnancies at the time of the survey (aOR=0.36, 95% CI: 0.18-0.73) and high PPI scores (aOR=0.16, 95% CI: 0.04-0.62) decreased the odds of being a covert contraceptive user. In the Nigerian bivariate analysis, having primary education, ever pregnant, past pregnancies before the survey, number of children, fertility intentions of not sure, if they wanted a child in future and a higher PPI score were CCU predictors. After adjusting for covariates, the odds of CCU increased among women who reported to have primary education level (aOR=2.55, 95% CI: 1.17-5.54) and among those who were not sure if they wanted children in future or not (aOR=1.92, 95% CI: 1.06-3.48). In the Ugandan bivariate analysis, having a university education and having a child 5 years and older were CCU predictors. In the multivariate analysis, the odds of CCU increased among women who reported having child/ren aged 5 years and above aOR=2.29, 95% CI: 1.37-3.84). Like Kenya, having a university education was found to be associated with reduced CCU odds (aOR=0.25, 95% CI: 0.08-0.78) in Uganda, Table 3.
Discussion
In this study, we investigated the prevalence and factors associated with covert contraceptive use in Kenya, Nigeria and Uganda. This paper builds on and contributes to a growing literature interested in the way women in sexual relationships use modern contraceptives without their partners’ knowledge. Although data was not meant to be representative, an interesting observation is in how the CCU prevalence relates to modern contraceptive’s prevalence in the three countries, Kenya with the lowest CCU prevalence was recently reported to have increased contraceptives prevalence at 58.1% [21] compared to Uganda, 27% [22] and Nigeria, 14.2% [23]. Albeit subtly, CCU and contraceptives prevalence confirm that couple communication has the potential to increase contraceptives’ uptake.
We also determined several factors associated with CCU across the three countries. In Kenya and Uganda, for instance, having a university education reduced the likelihood of women being CC users, this finding aligns with another study in Kenya which found that the odds of CCU increased among uneducated women [5]. Similalry, in Kenya, having a higher probability index score was associtated with reduced odds of using modern contraceptives covertly. In Nigeria, similar to Kenya and Uganda, education seem to be significant predictor of CCU, women who reported to have a primary level education or lower were more than two times likely to be CCUs. Although contraceptive use has for long been seen to be a potential driver of women’s reproductive health autonomy [1], a lot more needs to be done to the less educated women and those in the lower wealth quintile in society to empower them to have contraceptive related discussions with their partners. In some cultural settings in Kenya, Nigeria and Uganda, women’s contraceptive preferences are more often than not compromised largely due to systematic cultural dispositions. Religion has also been found to be a CCU predictor, this study determined that, in Kenya, being a Muslim or reporting to be associated with tradional religion was a significant predictor of increased likelihood of being a CCU. This is however contrary to a study done in Nigeria which determined that CCU prevalence was likely to be high among Christian women [24]. These disparate findings notwithstanding, religious belief system have been associated with a number of health related outcomes [24-26] mostly related to human fertility among other reproductive health outcomes. This study provides some potential indication of the deeply embedded religious and social norms related to culture and gender roles that could potentially contribute to CCU.
An interesting observation in this study is in how fertility intentions among those who reported not to be sure if they wanted more children in future increased the likelihood of being a CCU in Nigeria. Reproductive history, such as parity, fertility treatments and perinatal experiences might have signifciant effects on women’s birth intentions [27] with the potential of affecting their contraceptive behaviour. Couple concordance and communication on preferred number of children might help address CCU particualarly in Nigeria and other sub-Saharan African countries. Since there is little understanding of couple communication surrounding covert contraceptive use decisions, research should focus on characterizing content and context of couple communication particularly in cases of disagreement over fertility choices [9]. Interestingly, in Uganda having the youngest child/ren aged five years and above more than doubled the likelihood of being a CCU. Relatedly, one study in Uganda also found that, women used contraceptives secretly because they reported to be the ones undergoing the ‘hardship’ of raising their children as their men were driven by culture to have more children [12]. As earlier metioned, culture mixed with gender dynamics of individuals have been found to be associated with high fertility aspirations among men which ultimately leads to low or covert contraceptive use [28] among sexually active women. In Kenya, it was determined that, couples that discussed their desired number of children and contraceptive use were more likely to use contraception than couples that did not communicate with each other [29]. It should however be noted that, women are often faced with the challenge of balancing the physical and social benefits of using contraception covertly with the costs of concealing their use and the potential consequences of their discovery [12]. These findings therefore support the need for programming geared towards increasing communications among couples particularly to support male involvement in family planning and reproductive-health decision-making. Certainly, most family planning interventions in sub-Saharan Africa have been targeting women as the primary users, despite men often being primary decision-makers in most African settings. Involving men in sexual and reproductive health programs not only as birth companions but as contraceptives’ clients, supportive partners, and potential agents of change can encourage joint decision-making around contraception use [5,9,12,30]. Notably, sexual and reproductive health service providers need to be sensitized on how to educate women on the need to involve their male partners on matters contraceptives and work closely with policy makers to look for opportunities to link men to the public health system (in both established and non-established clinical settings) without compromising on the women’s contraceptive’s independence.
Limitations
This study had several limitations. First, there is limited generalizability for these findings as the sample was not representative of either country, district, state and/or county. In addition, because this study utilized a cross-sectional study design, we could not assess causality. Further, this paper only presents the reports of women regarding covert use, but the existing body of research suggests that this mode of direct measurement may only tell half the story, as conflicting reports are not uncommon when the perspective of the male partner is sought [14]. As noted, male partners were not part of this study and so, this might not be a true representation of CCU across the three countries.
Despite these limitations, this study adds to the current literature on prevalence and factors associated with covert contraceptive use. Findings may guide policy decisions on effective interventions for advocating for couple communication without compromising the contraceptive self-sufficiency of women.
Conclusion
This study confirms the existence of CCUs in all the three countries. There is need therefore to adopt flexible and sustainable strategies to improve couple contraception communication including sensitizing service providers in both clinically established and non-established clinical settings to educate women on the importance of male involvement in FP matters. In addition, policy makers should reiterate the benefits of couple communication to the service providers as well as designing interventions aimed at empowering and enlightening women particularly the low-income earners and those with little or no education on the benefits of male involvement while at the same time encouraging women to maintain their fertility independence.
Abbreviations: CCU: Covert Contraceptive Use; CM4FP: Consumer Market for Family Planning; FP: Family Planning; PSI: Population Services International.
Declarations
Ethical approval: Ethical approval was provided by the PSI Research Ethics Board (01.2019 and 04.2019), the AMREF Ethics & Scientific Review Committee in Kenya (P615-2019), the National Health Research Ethics Committee of Nigeria (NHREC/01/01/2007-27/05/2019), the Uganda National Council for Science and Technology review board (SS 5041 and SS 5104), and the Mildmay Uganda Research Ethics Committee (1105-2019). Informed consent was obtained from all survey respondents prior to conducting study procedures. To protect the identity of participants, consent was obtained orally, except in Uganda where consent was written as mandated by the in-country review board [20].
Consent for publication: Not applicable.
Availability of data and materials: The datasets used and/or analyzed during the current study are available from the corresponding author on reasonable request.
Competing interests: The authors report no competing interests in connection to this paper.
Funding: The Global Evaluation and Monitoring Network for Health (GEMNet-Health) supported this study as a deliverable for the GEM Net-Health fellowship.
Authors’ contribution: JM conceptualized the study on which this manuscript is based. JM performed the analysis and drafted the manuscript. CM provided technical support and helped with the analysis. All authors agreed on the final version of the manuscript. The authors read and approved the final manuscript.
Acknowledgements: We would wish thank Population Services International (PSI) for granting us access to the CM4FP data. We would also like to thank all the women who participated in the study and particularly for volunteering their information and enumerators who assisted in data collection.
References
- Gibbs A, Hatcher A. Covert family planning as a symbol of agency for young, married women. EClinicalMedicine. 2020; 23: 100393. Available from: https://doi.org/10.1016/j.eclinm.2020.100393
- Kennedy CE, Yeh PT, Gonsalves L, Jafri H, Gaffield ME, et al. Should oral contraceptive pills be available without a prescription? A systematic review of over-the-counter and pharmacy access availability. BMJ Glob Heal. 2019; 4(3).
- Kriel Y, Milford C, Cordero J, Suleman F, Beksinska M, et al. Male partner influence on family planning and contraceptive use: Perspectives from community members and healthcare providers in KwaZulu-Natal, South Africa. Reprod Health. 2019; 16(1): 1-15.
- Grabert BK, Speizer IS, Domino ME, Frerichs L, Corneli A, et al. Couple communication and contraception use in urban Senegal. SAGE Open Med. 2021; 9: 1-11.
- Akoth C, Oguta JO, Gatimu SM. Prevalence and factors associated with covert contraceptive use in Kenya: a cross-sectional study. BMC Public Health. 2021; 21(1): 4-11.
- Asa UA, Nkan V V, Okoro GI. Spousal communication and contraceptive use among married couples in rural areas of Akwa Ibom State, Nigeria. J Educ Soc Res. 2018; 8(1): 51-8.
- Gasca NC, Becker S. Using couples discordant reports to estimate female covert use of modern contraception in sub-Saharan Africa. J Biosoc Sci. 2017; 50(3): 326-46.
- Choiriyyah I, Becker S. Measuring Women’s Covert Use of Modern Contraception in Cross-Sectional Surveys. Stud Fam Plann. 2018; 49(2): 143-57.
- Challa S, Shakya HB, Carter N, Boyce SC, Brooks MI, et al. Associations of spousal communication with contraceptive method use among adolescent wives and their husbands in Niger. PLoS One. 2020; 15: 1-13. Available from: http://dx.doi.org/10.1371/journal.pone.0237512
- Heck CJ, Grilo SA, Song X, Lutalo T, Nakyanjo N, et al. It is my business: A Mixed-Methods Analysis of Covert Contraceptive Use among Women in Rakai, Uganda. Contraception. 2018; 98(1): 41-6.
- Rowlands S, Walker S. Reproductive control by others: Means, perpetrators and effects. BMJ Sex Reprod Heal. 2019; 45(1): 61-7.
- Kibira SPS, Karp C, Wood SN, Desta S, Galadanci H, et al. Covert use of contraception in three sub-Saharan African countries: A qualitative exploration of motivations and challenges. BMC Public Health. 2020; 20(1): 1-10.
- Silverman JG, Challa S, Boyce SC, Averbach S, Raj A. Associations of reproductive coercion and intimate partner violence with overt and covert family planning use among married adolescent girls in Niger. EClinicalMedicine. 2020; 22: 100359. Available from: https://doi.org/10.1016/j.eclinm.2020.100359
- OlaOlorun FM, Anglewicz P, Moreau C. From non-use to covert and overt use of contraception: Identifying community and individual factors informing Nigerian women’s degree of contraceptive empowerment. PLoS One. 2020; 15: 1-14. Available from: http://dx.doi.org/10.1371/journal.pone.0242345
- Macquarrie KLD, Mallick L, Kishor S. DHS ANALYTICAL. 2016.
- De Sousa J, Burgess W, Fanslow J. Intimate partner violence and women’s reproductive health. Obstet Gynaecol Reprod Med. 2014; 24(7): 195-203. Available from: http://dx.doi.org/10.1016/j.ogrm.2014.04.012
- Maxwell L, Brahmbhatt H, Ndyanabo A, Wagman J, Nakigozi G, et al. The impact of intimate partner violence on women’s contraceptive use: Evidence from the Rakai Community Cohort Study in Rakai, Uganda. Soc Sci Med. 2018; 209: 25-32. Available from: https://doi.org/10.1016/j.socscimed.2018.04.050
- Balogun O, Adeniran A, Fawole A, Adesina K, Aboyeji A, et al. Effect of Male Partner’s Support on Spousal Modern Contraception in a Low Resource Setting. Ethiop J Health Sci. 2016; 26(5): 439-48.
- Fox E, Reyna A, Malcolm NM, Rosmarin RB, Zapata LB, et al. Client Preferences for Contraceptive Counseling: A Systematic Review. Am J Prev Med. 2018; 55(5): 691-702. Available from: https://doi.org/10.1016/j.amepre.2018.06.006
- Conlon M, Buyungo P, Njogu J, Nwala A, Gibbs S, et al. Linking family planning market census data with consumer experiences in three countries: The Consumer’s Market for Family Planning study protocol and data. Gates Open Res. 2021; 5: 176.
- FP 2020. FP2030 & FP2020 Commitments. 2021. Available from: https://fp2030.org/kenya22. Namasivayam A, Lovell S, Namutamba S, Schluter PJ. Predictors of modern contraceptive use among women and men in Uganda: A population-level analysis. BMJ Open. 2020; 10(2): 1-11.
- Ekholuenetale M, Olorunju S, Fowobaje KR, Onikan A, Tudeme G, et al. When Do Nigerian Women of Reproductive Age Initiate and What Factors Influence Their Contraceptive Use? A Contextual Analysis. Open Access J Contracept. 2021; 12: 133-47.
- Obasohan P. Religion, Ethnicity and Contraceptive Use among Reproductive age Women in Nigeria. Int J MCH AIDS. 2014; 3(1): 63-73.
- Götmark F, Andersson M. Human fertility in relation to education, economy, religion, contraception, and family planning programs. BMC Public Health. 2020; 20(1): 1-17.
- Krull LM, Pearce LD, Jennings EA. and Contraception. MDP1. 2021.
- Preis H, Tovim S, Mor P, Grisaru-Granovsky S, Samueloff A, et al. Fertility intentions and the way they change following birth-a prospective longitudinal study. BMC Pregnancy Childbirth. 2020; 20(1): 1-11.
- Vishwakarma M, Shekhar C. Covert use of reversible contraceptive methods and its association with husband’s egalitarian gender attitude in India. BMC Public Health. 2022; 22(1): 1-13. Available from: https://doi.org/10.1186/s12889-022-12882-x
- Irani L, Speizer IS, Fotso JC. Couple Characteristics and Contraceptive Use among Women and their Partners in Urban Kenya. Int Perspect Sex Reprod Heal. 2014; 40(1): 11-20.
- Adewuyi A, Ogunjuyigbe P. The Role of Men in Family Planning: An Examination. African Popul Stud. 2003; 18: 1. Available from: http://www.bioline.org.br/abstract?ep03003